This section of the quick tour shows how to open and use contig views and two related views, the trace view and the quality view. Contig editing and navigation are described in the next sections.
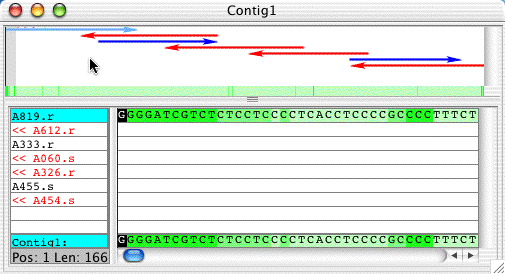
In the project view, select the contig "Contig1" which you assembled in the previous section, and then go to the "View" menu and select "Contig" (or just double-click on the contig in the project view). This will open the "Contig View", which shows the aligned bases in the contig, as well as a graphical overview:
The contig view consists of two main parts: a graphical overview at the top (the "Overview Panel"), and the sequence names and aligned bases at the bottom (the "Aligned Bases Panel"). We'll explain the two panels in turn. You can resize the panels by clicking on the bar in between the panels, and dragging it up or down (try it!).
The overview panel at the top shows how the reads are placed in a contig. Forward reads are shown in blue, reverse reads in red. Selected reads are shown in a lighter color. When you open a contig view, the first base in the consensus is selected. When a consensus base is selected, the corresponding bases in all reads that have a base at this position are also selected; in the example above, this means the first read (A819.r) is selected.
The gray rectangle near the front indicates which part of the contig is currently shown in the lower panel. The thin vertical blue line shows where the cursor is currently located - here, at the very beginning of the contig.
You can use the overview panel to quickly move around in a contig. If you click on an arrow, the corresponding sample will be selected. If you click somewhere else, the consensus base at this spot will be selected (and, as we said above, all samples that have a base at this position).
When clicking in the overview panel, the lower panel changes according to your new selection. Go ahead, try it out - click at a few different places in the overview panel! You can also click on the green "consensus quality" region at the bottom of the overview panel. This allows you to quickly move to the lower quality consensus regions, which show up as vertical lines in a darker shade of green (we will show other ways to navigate to low-quality regions in the next section).
The lower part shows the aligned bases of the individual samples, and the consensus sequence. The bases are drawn on colored background, with the color indicating the quality. Darker backgrounds mean lower quality; in the example above, the dark green background mean qualities below 20, the medium green background means qualities of 20 to 29, and the light green background means qualities of 30 and higher. The same colors are used at the bottom of the overview to indicate the consensus sequence quality.
You can move around in the aligned bases panel by using the scoll bar at the bottom, or by using the keyboard. Try moving around using the scroll bar first, and look at the overview panel. You will notice that the gray rectangle moves, indicating that a different part of the contig is shown; but the blue line for the cursor position does not change until you also click on a base in the aligned base panel.
Next, let us try moving with the keyboard. Click on a consensus base (at the bottom) to select it. Then:
If you have a mouse with a scroll wheel, you can also use the scroll wheel to move around in a contig. Moving the scroll down will move forward in a contig, moving up will move backwards. If you have a contig with many reads in it, then pressing the "control" key while scrolling with the mouse wheel will move the read list up and down.
Note that mouse scroll wheels are supported only on OS X 10.3 and newer and on Windows, but not on OS X 10.2.
You can change the way the bases are drawn in Aligner's preferences. Open the Preferences dialog (on Windows, in the "Edit" menu; on OS X, in the "CodonCode Aligner" menu), and then select "Base colors" on the left side. Your dialog now should look like this:

Try out the different color schemes at the top, and different settings for each of the schemes to find one your like (note that you will need to press the "OK" button before the changes take effect).
You can also change how things like discrepancies or ambiguities are highlighted. To do this, go to the preferences, and selected "Highlighting" on the left side. Click on the pull-down list next to "Discrepancies", and select "box". Click OK, and then scroll around in the contig view. See the effect of your changes?
To view protein translation in the aligned bases panel, go to the "View" menu, and select "Protein Translation". You can either view the protein translation for one frame, for all three frames in forward direction, or for all three forward and three reverse frames. You can choose additional option by choosing "Preferences...", or by opening the Preferences dialog as described above and then selecting "Protein translation" on the left side of the dialog. A contig view with protein translation for the three frames looks like this:
![]()
To view the translation of the complimentary strand, click on the little blue arrow next to the first line of the protein translation. Click it again to switch back to forward translation.
To view the sequence chromatograms (the "traces"), you can double-click in the overview panel or on a base in the aligned base panel, or you can select "Traces" from the "View" menu.
This will open a new window showing the traces for your selected samples. If you double-clicked on a consensus base, all samples that have bases at this position will be shown. If you clicked on a sample base (or on an arrow in the overview panel), only the trace for this sample will be shown. The "trace view" window looks like this:

Open a trace view with 2 or 3 traces by double-clicking in the overview panel (somewhere in the white space, not on an arrow). Then, try the following:
If you have a mouse with a scroll wheel, you can also use the scroll wheel to move around in the trace view window. Position the mouse over a trace, and move the scroll up or down to move to the right or to the left. Next, keep the control key pressed while scrolling with the mouse wheel: this has the same effect as using the vertical scroll bar, making peaks larger or smaller.
If the trace view window contains many traces (or if it is small), not all traces will be shown on the screen. In this case, you can use the scroll bar on the right of the window to scroll up to the "hidden" traces. You can also use the mouse wheel to scroll between traces, as long as you place the pointer directly above the vertical scroll bar. Try it out by first making the
Note that mouse scroll wheels are supported only on OS X 10.3 and newer and on Windows, but not on OS X 10.2.
If a trace view window is the active window, only one sample can be selected. Try this by going to the contig view and clicking on a consensus base or in the overview panel, and then clicking on the trace view. This means that if you edit in the trace view, you will always only edit one sample. To edit several samples simultaneously, you need to do the editing in the contig view, where selecting a consensus base will also select all sample bases at this position.
This may seem a bit arbitrary, but it avoids a number of possible problems. If you have strong feelings about this, please let us know.
If you have both a contig view and the corresponding trace view open, Aligner can automatically add and remove traces in the trace view for you. You can determine what exactly Aligner does in the "Views" preferences:

Make sure that the check box before "Automatically pick 3 traces to show" is checked. You can also change the number of traces Aligner will show to any number from 1 to 5. Click OK, and then go back to the contig view. Make sure the trace window for the contig is showing, and then move around the contig by clicking in the overview panel. Notice how Aligner will automatically add the traces at your current position to the trace view, and remove traces for samples that do not have bases at this position (in our example project, many positions in the contig are covered by only one or two samples, so Aligner will be able to show only one or two traces, even if you set the preferences to show 3, 4, or 5 traces).
What if you just want to quickly look at regions in your contig where the quality is low? One way to do this is to use the quality view for the contig. Go to the project window, and then select "Qualities" from the view menu. This will bring up the quality view for the contig:

Qualities for consensus bases range from 0 to 90, with higher numbers corresponding to higher quality on a logarithmic scale (how consensus quality is determined is described in the "Consensus calculation" section of the online help). Go ahead and click on the low quality regions in the quality view, for example the drop near base 1430. This will also more the contig view to this position (you may have to bring ot to the foreground using the "Window" menu). If you also have a trace view open and automatic trace selection enabled, you should also see traces at this position. This allows you to quickly see what is going on - in the example here near base 1433, the drop is due to compressions in the traces in a GC-rich region. (There is a known bug in the trace positioning when you use the contig view to navigate, which may result in the trace view not being positioned correctly; we hope to have this fixed in the next release).
In the examples above, we described how to move around in a contig using the contig view and the quality view. Often, you may want to look at more specific regions, for example all discrepancies or all low-quality consensus regions. The next section describes how to define such "features" or "regions of interests", and how to quickly move through all the "regions of interest" in a contig.
Aligner Home Page - Quick Tour Start - Previous - Next: Navigating