![]()
Introduction
During the past three years, the programs PHRED and PHRAP (developed by Phil Green and co-workers) have become the de-facto standard for base calling and sequence assembly in large-scale DNA sequencing projects. PHRED was trained to call bases and assign quality values to those base calls, by using data sets generated on ABD sequencers, (B. Ewing & P. Green (1998), Genome Research 8: 186-194). However, since PHRED was not trained with data generated on LI-COR sequencers, it does not call bases or assign accuracy values on LI-COR generated data (Base ImagIR software version 4.0 and earlier) nearly as well as it does with ABD data. With the increased use of LI-COR sequencers in genome centers, several LI-COR customers expressed the need to use PHRED and PHRAP within ongoing large-scale sequencing projects. This need required us to optimize trace files ("SCF files") generated by LI-COR Base ImagIR software for PHRED and PHRAP.
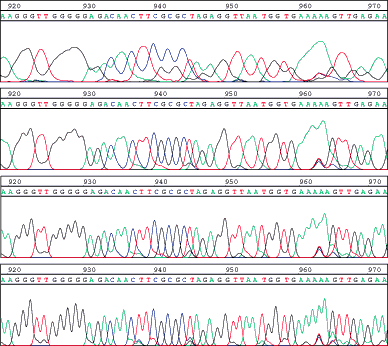
A main objective was to ensure that quality scores calculated by PHRED from LI-COR generated data were as accurate as PHRED quality scores from ABD data. To achieve this goal of accurate quality scores, the image processing steps which precede the generation of SCF files were examined and fine-tuned for PHRED use (see Figure 1). The accuracy of PHRED quality scores for SCF files generated with different settings for the image processing steps was assessed by comparing actual and predicted error rates from several different view points:
- as a function of quality score, using bins of 5-10 quality values;
- summed over all reads in a project within 50-base windows;
- on quality-sorted subsets of all sequences in a given project.
Figure 1. LI-COR traces at different image processing settings. The same region from a sequence trace at base 919 to 972 is shown, processed with different image process settings. The top level shows the trace with minimal processing; this is how traces with previous software versions were stored. The second trace shows the same trace at image processing settings that give the most accurate PHRED quality scores. The bottom panel shows the trace as the LI-COR base caller Base ImagIR "sees" it.
PHRED Adaptation Results
Initial results indicated that PHRED was overly "pessimistic" in assigning quality values to LI-COR traces that had been generated with previous versions of BaseImageIR software. This trend can be clearly seen in Table 1 (Section "Previous image processing settings"). For quality values between 15 and 40, the actual number of errors was 2- to 4-fold lower than predicted by transforming PHRED quality values into error probabilities. Through optimizing the extent of image processing, however, accurate PHRED quality values could be achieved (see Table 1, Section "Optimized image processing settings"). For the entire range of quality values, the actual number of errors is close to the predicted number of errors; the slight over-prediction of errors that can be seen has also been observed with ABD-generated data (see Richterich (1998), Genome Research 8: 251-258).
Table 1. Actual and predicted errors at different settings.
Previous Image
Processing SettingsOptimized Image
Processing SettingsQuality Bin Center
Aligned Bases
Predicted Errors
Actual Errors
Aligned Bases
Predicted Errors
Actual Errors
5
20865
4819.0
3382
11480
2788.8
2203
10
43426
5017.7
3743
33616
3733.4
3450
15
20162
711.4
260
20684
723.6
499
20
16110
183.6
47
18897
208.7
196
25
15650
54.5
13
21055
73.3
71
30
15488
16.1
8
22218
22.9
24
35
40631
12.2
6
50823
15.5
16
40
27326
3.0
1
46588
4.9
5
45
34132
1.1
1
55419
1.7
2
50
20569
0.1
0
44939
0.4
0
Total
254359
10818.7
7461
325719
7573.2
6466
A positive side effect of the optimized image processing parameters can also be seen in Table 1: the total number of aligned bases increased by approximately 20%. Another indication of PHRED's improved performance is the significantly higher number of bases with high quality scores. With optimized settings, 44,939 aligned bases had quality values of 47 to 51 (corresponding to error probabilities near 1 in 100,000), compared to only 20,569 bases with non-optimized settings.
As shown in Figure 2, the agreement of actual and predicted error rates is very good over the entire range of the sequence reads, from base 1 to beyond base 1,000. The observed pattern of slight under-prediction of errors below base 400, followed by a slight over-prediction thereafter, is again similar to the patterns observed with data that were generated on ABD sequencers. Separation of data into four subsets, based on data quality, also showed excellent agreement between predicted and actual error rates (not shown).
Figure 2. Actual and predicted error rates in 50 base windows with optimized processing parameters.
The chosen value for the image processing parameter that gave accurate PHRED quality values corresponded to a x-axis value of 1.4 in Figure 3 and Figure 4. Figure 3 indicates that PHRED's base calling performance was improved even more at higher values for this parameter, as judged by the number of actual errors and the alignable read length (not shown). However, PHRED was overly "optimistic" at these higher values: the number of actual errors exceeded the number of predicted errors. This was most pronounced for high quality values, as shown in Figure 4. Such overly "optimistic" quality values can lead to problems in assemblies with PHRAP, when PHRAP interprets random errors as caused by repeats. Therefore, a setting corresponding to an x-axis value of 1.4 was incorporated as the default value in the version 4.1 BaseImagIR software.
Figure 3. Actual and predicted errors at different image processing settings.
Figure 4. Actual and predicted "high quality" errors at different image processing settings.


